Operationalizing Mitre's ATT&CK Framework

An introduction to the Mitre ATT&CK framework, the Mitre ATT&CK Navigator, and some example processes to get you started.
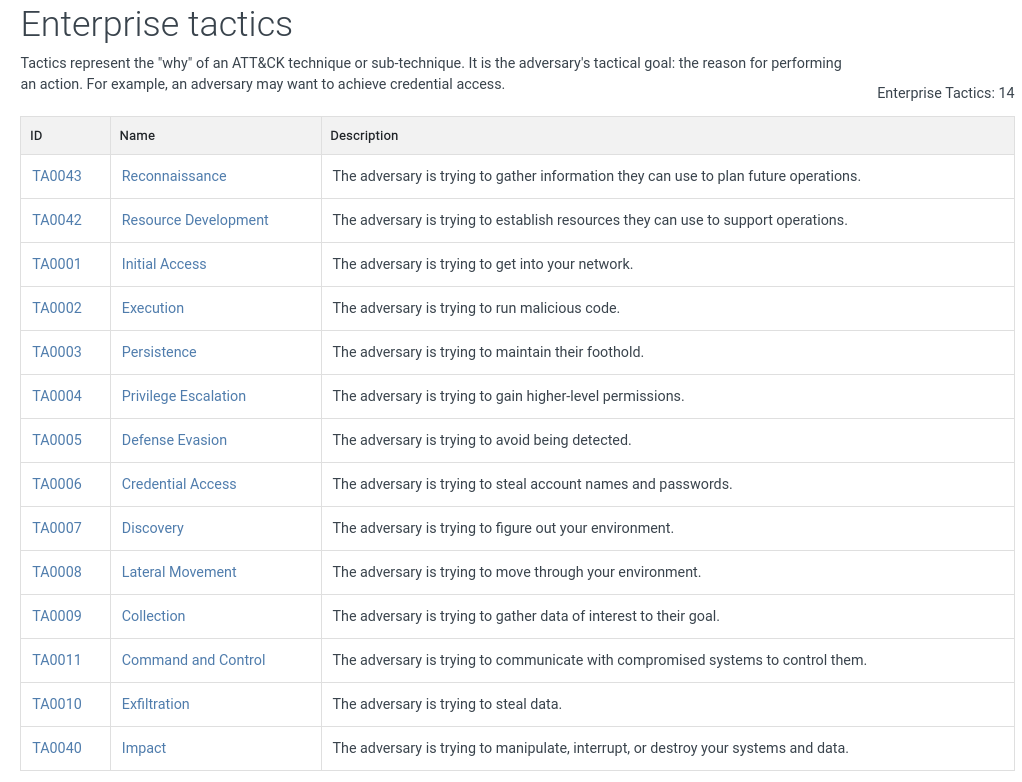
A Quick Overview of Mitre's ATT&CK Framework
Mitre's description from the ATT&CK website:
MITRE ATT&CK® is a globally-accessible knowledge base of adversary tactics and techniques based on real-world observations. The ATT&CK knowledge base is used as a foundation for the development of specific threat models and methodologies in the private sector, in government, and in the cybersecurity product and service community.
What this means in english is - it's a way to effectively communicate adversary TTP's across organizations in a consistent manner. It's an incredibly helpful tool that can help an organization jumpstart a basic threat intelligence program as we'll see.
NOTE: While the coverage for Mitre's ATT&CK Framework is great, it is not all encompassing for every technique out there. There may be some adversary techniques that are missing that are valid techniques.
What is the ATT&CK Navigator?
It's a web-app created by the Mitre Foundation that helps make building heatmaps of adversary TTP's incredibly easy. It can be found here.. We'll dig into basic useage at the end - the real goal of this blog is to provide example processes that you can implement to operationalize Mitre's ATT&CK itself.
The Value of Heatmaps
So - now that we know what the ATT&CK Navigator is, let's talk about a few ways we can operationalize it and how it can be used.
One of the more common ways to use it at a more operational level is through the use of a heatmap as pictured below.

The basic idea behind heatmaps is that the more times a technique appears, the darker the "square" the technique resides within appears. It's becoming common for Cyber Security Vendors to provide a heatmap of the attack trends they have observed in their annual reports and even sometime going the extra mile to share an ATT&CK Navigator layer. So - how can we benefit from them?
Use Case: Heatmaps of Detection Coverage
In a prior life - I co-authored a white paper on doing Detectors as Code. This was an actual real process that we used while I was at said organization (though much more extended for our needs), and one of the largest value adds was the ability to tag all of your detectors with meta data, such as Mitre ATT&CK techniques.
Understanding how your detection coverage compares to current threat intelligence reports can be a great way to help guide a detection program in terms of prioritization.
For example - most of the major security vendors release annual (or even quarterly) threat intelligence reports and they've commonly started to include a Mitre ATT&CK Navigator json file that you can use to upload as an ATT&CK Navigator layer. You can then overlay your detection logic with the threat intelligence provided from said third party and help prioritize your detection and response to said attacks.
It's also not uncommon for detection tooling to allow you to provide custom meta data tags such as Mitre ATT&CK technique meta data to your detection logic. A common hurdle people run into however is:
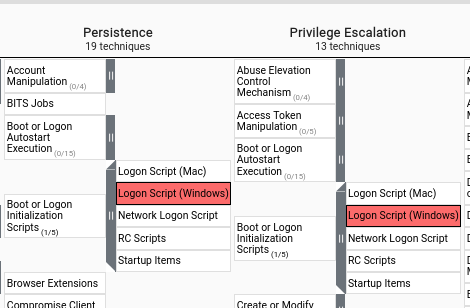
The detector I wrote covers multiple Mitre ATT&CK techniques, potentially also in differing tactic verticles (IE: Execution/Persistence/Defense Evasion) which may not always match 1 for 1 with how the technique was used in an incident. (IE: In a real incident, the adversary may use a Logon Script (T1037.001) as a method for Persitence, yet it may NOT have been used as a method for Privilege Escalation yet the way the detection logic is written may detect both with the same detector.)
That is okay. Keep in mind - your detection coverage is different than a heatmap of observed activity. Which leads us into our second use case...
Use Case: Heatmaps/Metrics of Observed Activity
So - you've started aligning your organizations detection coverage to the Mitre ATT&CK Framework... now what? Now we operationalize the data through... more heat maps and metrics.
First - lets talk about how we can overcome the pesky problem of detectors sometime having overlapping tactic verticals. When an alert is received, it is important to ensure that at some point within the investigative process, the tactic is prepended to said tag.
Taking the above example of using technique Logon Script (T1037.001) for persistence and not privilege escalation we'd actually want to ensure that the tactic is pre-pended to the technique - making the final tag really: TA0003.T1073.001.
Again - we do this to ensure that the activity observed in the incident is recorded accurately.
As I mentioned earlier - through the use of your detection tooling, you can add the ATT&CK Framework to your detection through the use of tags. (If you're detection tooling doesn't support this, consider using a Detectors as Code approach where you can assign your own meta data to your detection logic.)
If you're using case management tooling, such as the popular open source tool known as The Hive, you can now start building out charts and metrics. Something as simple as a Top X most common Mitre ATT&CK Tactics & Techniques observed in said cases that had been closed as a malicious true positive over XYZ period of time. This alone gives you hard metrics to provide senior leadership with the data they need to:
- Make decisions on improving prevention/detection through the most abused tactics and techniques specific to your org
- Can play a role in prioritizing future detection logic by comparing layers of your detection coverage vs detected activity
- Be used as a data point to push stricter security policies that may have been pushed back on in the past.
Beware of Survivorship Bias
Be thoughtful in being aware that your detection coverage as well as your detected activity will be skewed torwards the controls your organization has in place. An EXCELLENT example of this being called out and demonstrated is through Red Canary's Threat Detection Reports, specifically in their methodology section which states:
Limitations
There are a few limitations to our methodology for counting threats, as there are for any approach. Due to the nature of our visibility (i.e., that we predominantly leverage endpoint detection and response data), our perspective tends to weigh more heavily on threats that made it through the external defenses—such as email and firewall gateways—and were able to gain some level of execution on victim machines. As such, our results are likely different than what you may see from other vendors focused more on network or email-based detection. For example, though phishing is a generally common technique, it didn’t make it into our top 10.
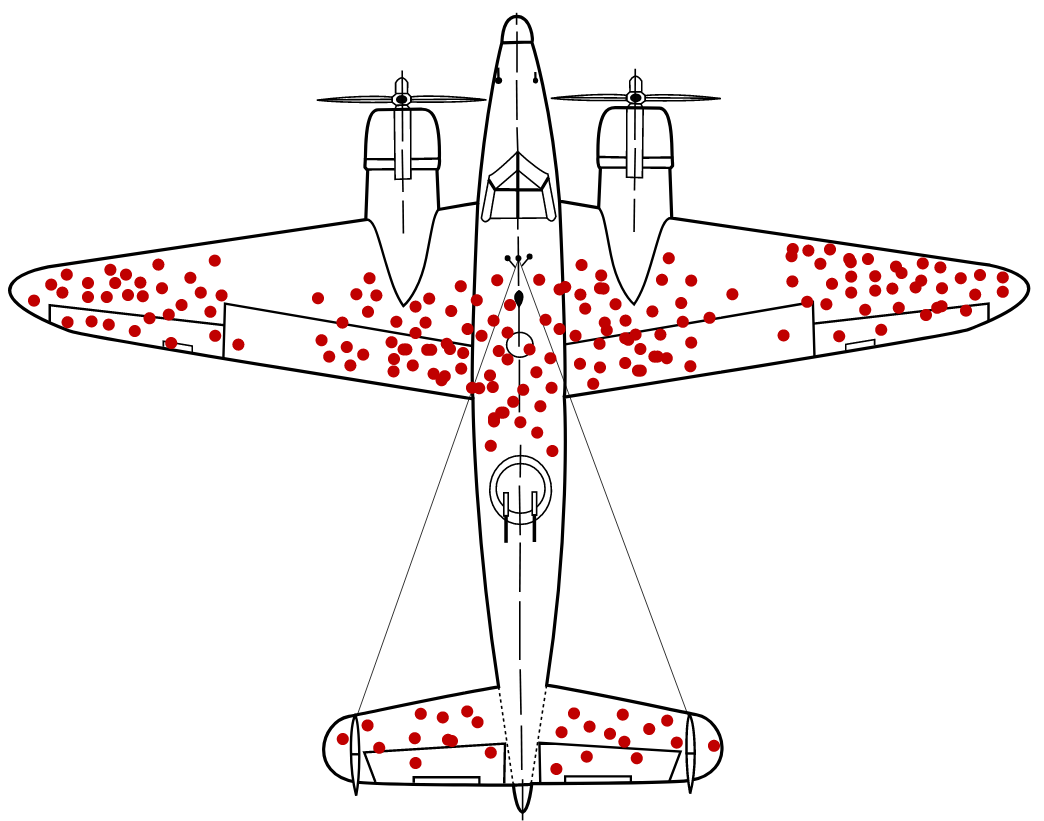
You should be warry of this for your organization as well. When reading blogs around detection, there is a very commonly referenced story of survivor ship bias from the Airforce around hardening the armor for their planes in WW2.
From Wikipedia:
During World War II, the statistician Abraham Wald took survivorship bias into his calculations when considering how to minimize bomber losses to enemy fire.[16] The Statistical Research Group (SRG) at Columbia University, which Wald was a part of, examined the damage done to aircraft that had returned from missions and recommended adding armor to the areas that showed the least damage.[17][18][19] The bullet holes in the returning aircraft represented areas where a bomber could take damage and still fly well enough to return safely to base. Therefore, Wald proposed that the Navy reinforce areas where the returning aircraft were unscathed,[16]: 88 inferring that planes hit in those areas were the ones most likely to be lost. His work is considered seminal in the then-nascent discipline of operational research.
ATT&CK Navigator 101
The ATT&CK Navigator is fairly straight forward in how it works. To keep this light and with the most basic useage - we're going to focus on really three sections of the navigator: search & multiselect, scoring, and utilizing multiple layers in the ATT&CK Navigator.
First: Creating your base layer
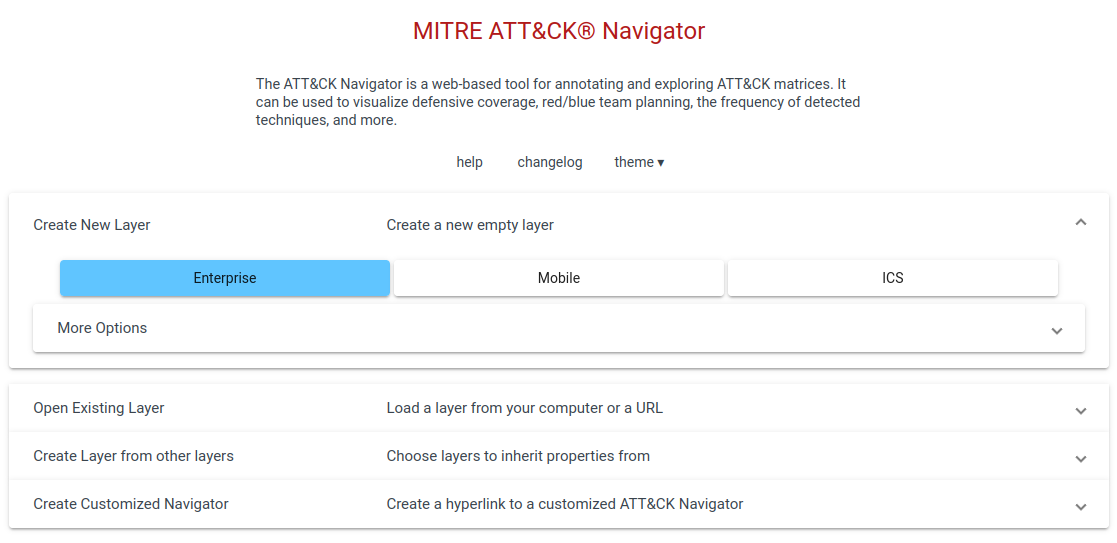
Select Create New Layer and choose the Enterprise options as seen above.
Next we'll want to name our first layer. You can do this by double clicking the tab, lets name it after a threat group. For this example we're going to use Cobalt Group.

From the controls in the upper right hand corner, search for the group by selecting the magnifying glass (search and multiselect). This should pop out a screen that looks like this:
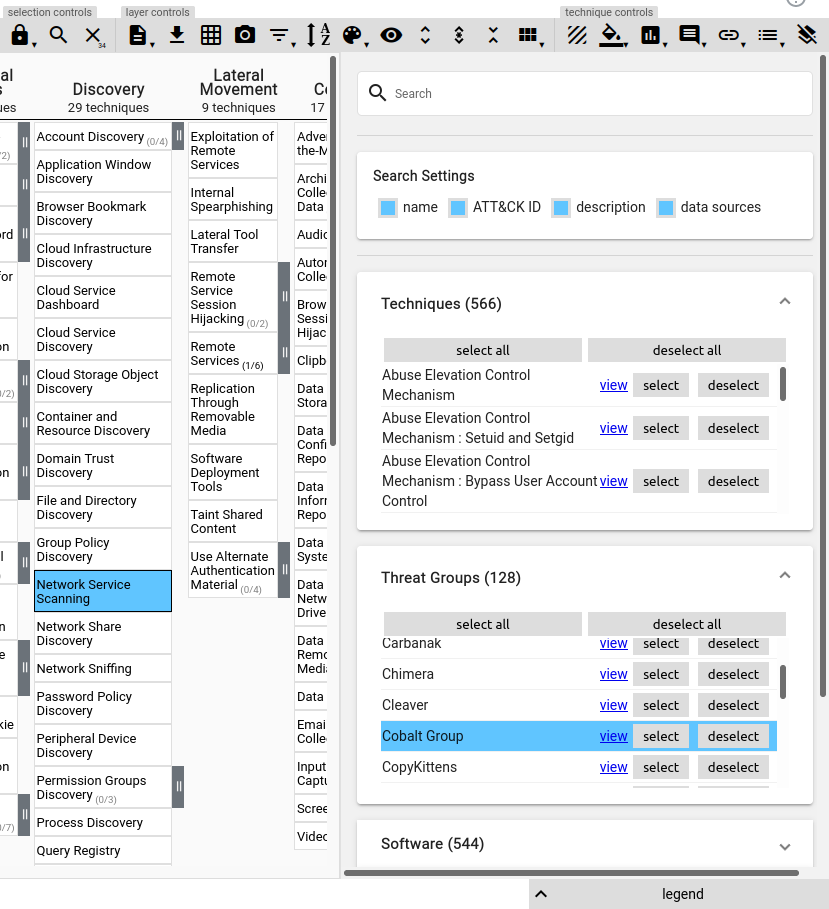
From there, scroll down and look for the threat group in question, in our example again we're going to find and select the Cobalt Group. This will "select" the Techniques used by the group in question.
Lastly - we'll add scoring, this will effectively be the "weight" each group carries. For example, if you know a certain threat actor has actively targeted your organization in the past, you may want to give them a higher "score" (or weight).
The higher the score of a technique, the darker shade of color it appears on the navigator - IE: If you've observed a technique 10 times, it'll appear darker than a technique that you may have only observed once or twice.
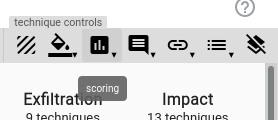
To set the score of a selection of techniques from the controls in the upper right hand corner:
Repeat this process a few times to create a few separate layers using the groups you'd like so you ultimately end up with something similar to this:
Once you have a few various layers created with the score set individually on each of the layers - we'll want to create one final layer that overlays them all together.
This time we'll select Create From Other Layers which will pop open a large selection, as well as adding highlighted letters to correspond with each layer on the tabs as you'll see below.
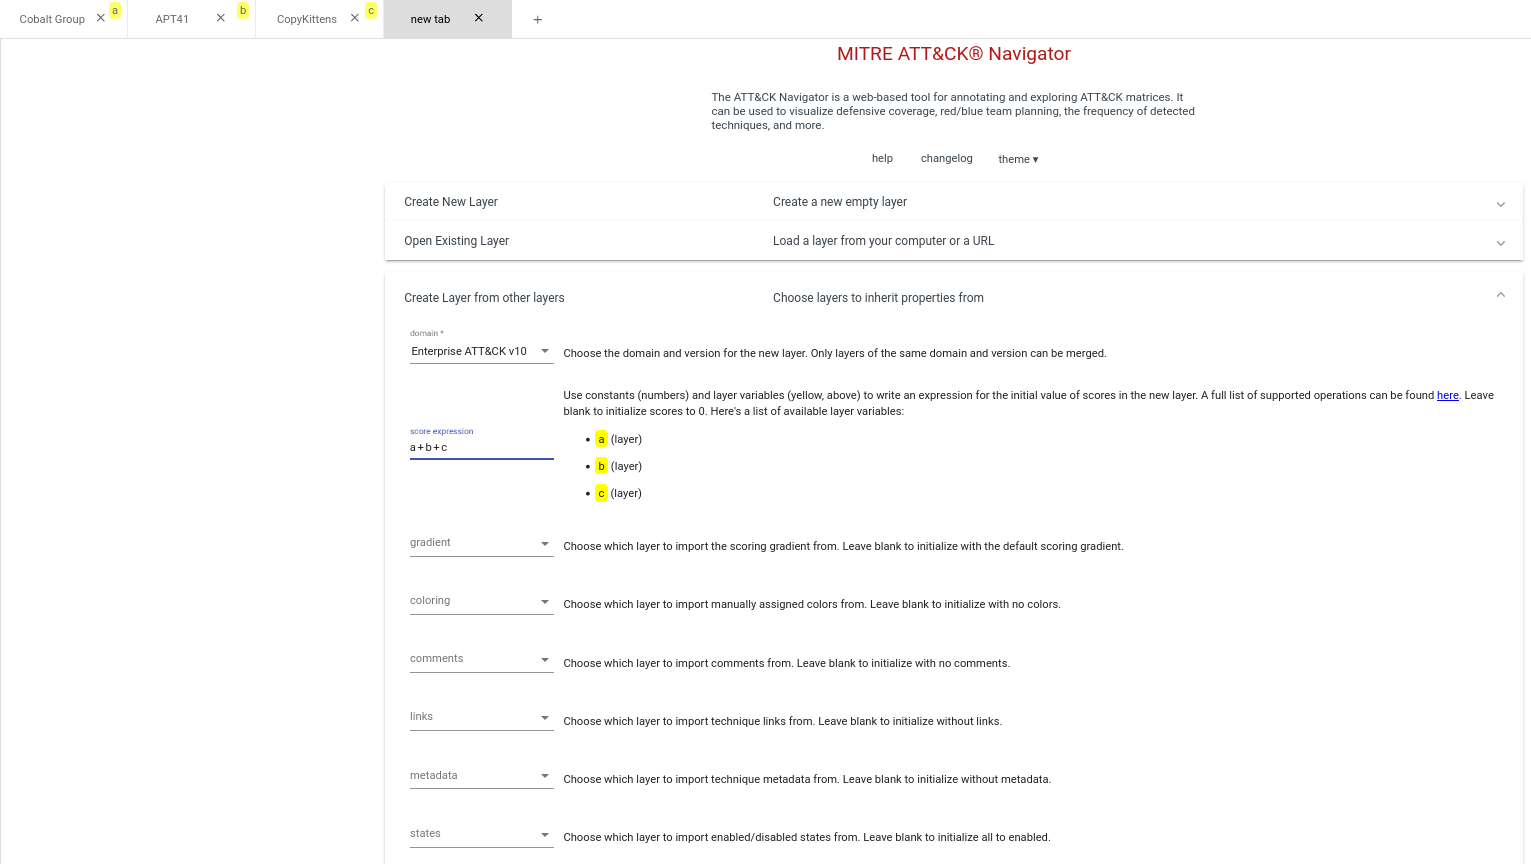
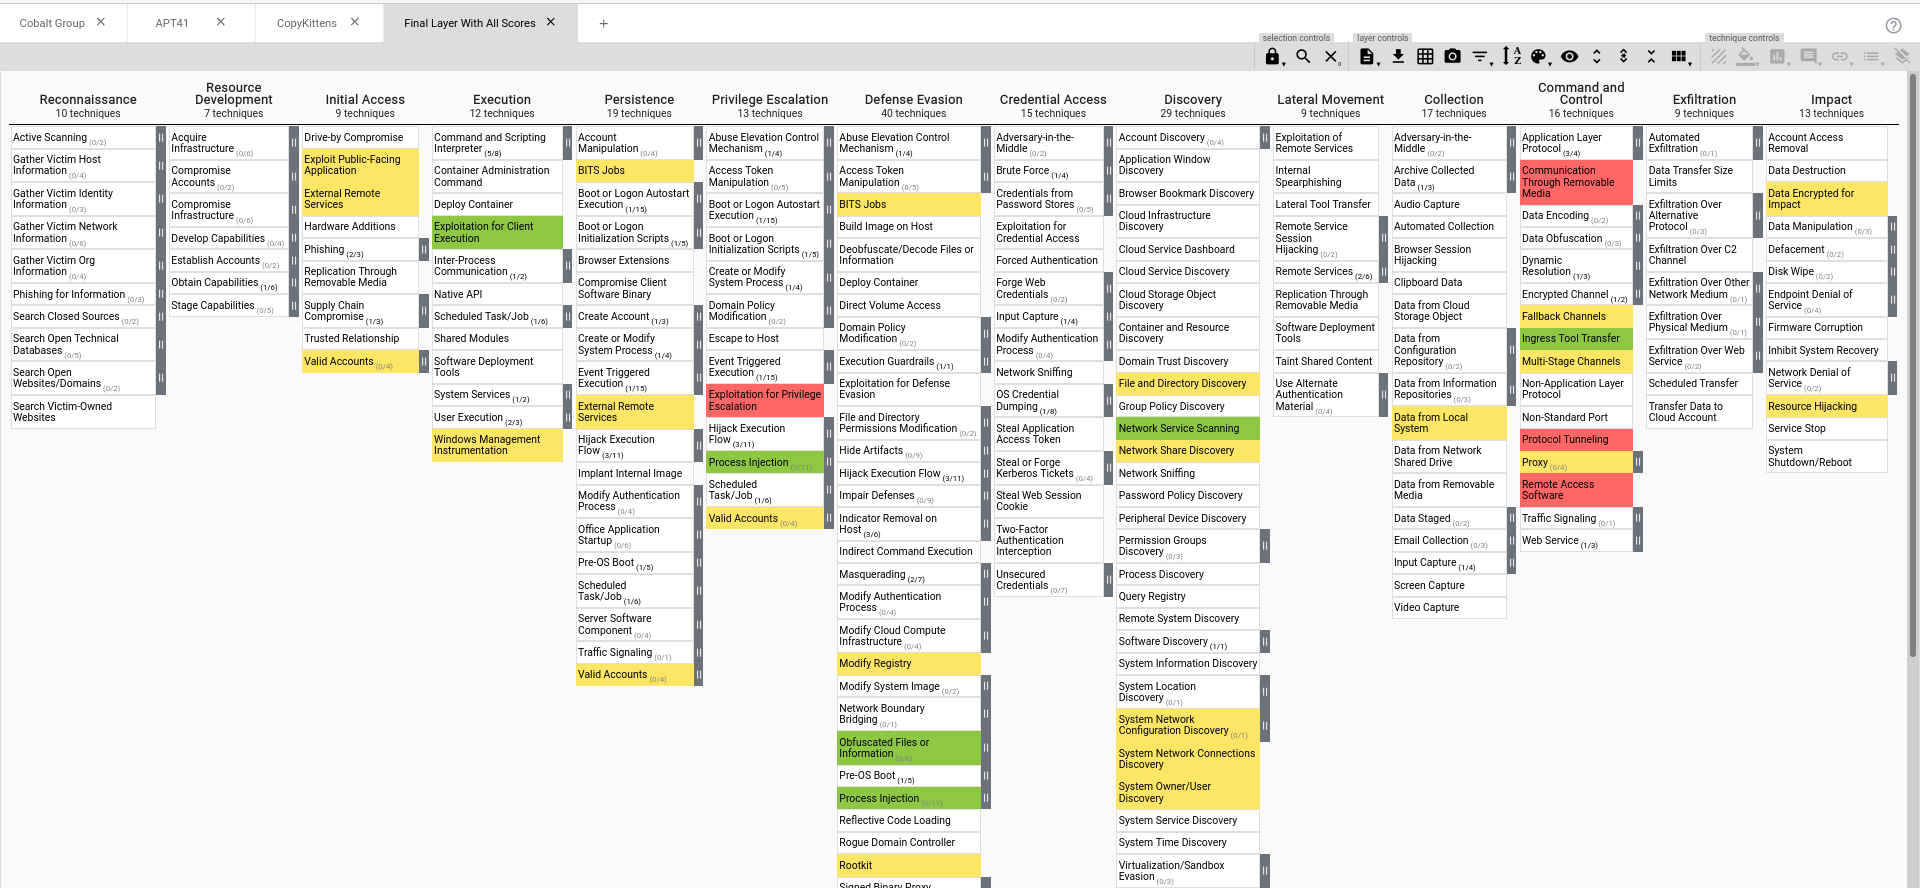
Select Enterprise ATT&CK v10 from the domain drop down and fill out the score expression which is how you want to overlay the layers on top of each other. For example - if I want to see a heatmap of all of the techniques used by the various group I'd enter a+b+c as seen above.
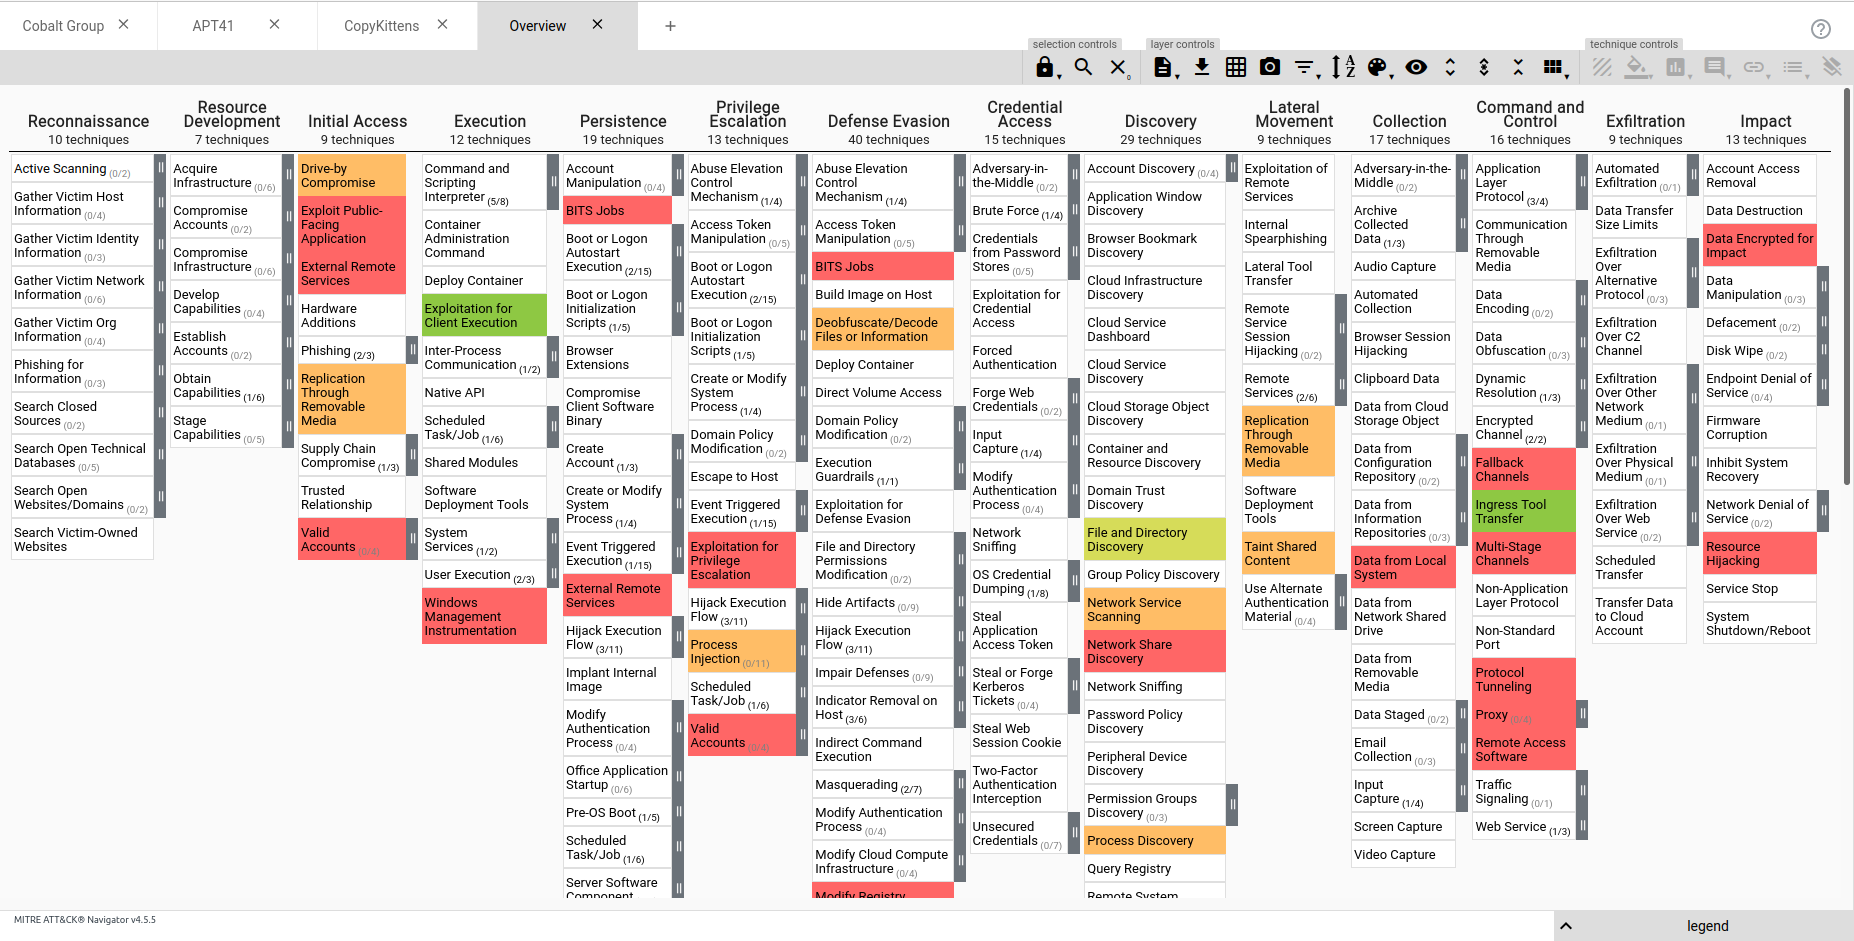
This will generate our final output with all of our layers overlapped on top of each other, and the scores from each technique in each layer will be added together to create a single layer as seen below:
A much better more indepth and official piece of documentation of using the ATT&CK navigator to show a similar process can be found here. (PDF Warning)
Final Things to Consider
My goal with this blog post was to teach a few ways organizations could operationalize the Mitre ATT&CK framework as well as to show some basic ATT&CK Navigator useage to get your organization started.
Consider in the above exercise where we created the heatmaps:
- Rather than selecting various
threat groupsto populate the navigator, what would happen if you followed the same exercise with individual intrusions observed in your environment? - If you've aligned your detection coverage to Mitre's ATT&CK, how much of the Actual Intrusion heatmap does your Detection heat map cover?
- How do you handle techniques that may not be within the Mitre ATT&CK Matrix yet?
Hope all of this fancy new data helps increase your security budgets. Cheers.
Find a technical error in a blog post?
Contact me on BlueSky @signalblur